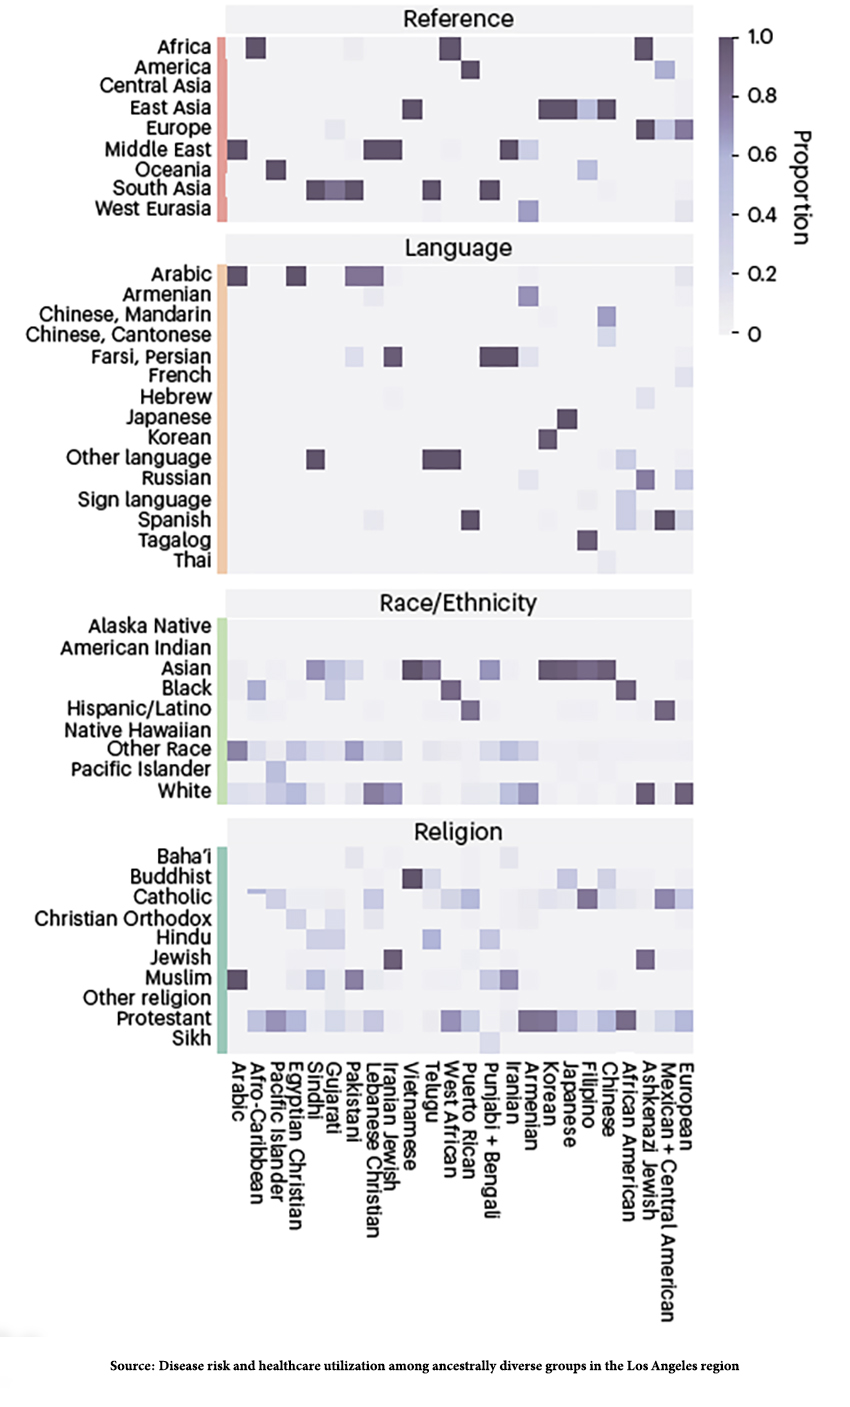
The study looks at the risk of disease and healthcare utilization for a population in Los Angeles participating in UCLA’s ATLAS Community Health Initiative. The ATLAS contains a genetic characterization of roughly 36,000 individuals and is tied to their health records. As the researchers write,
“ATLAS demographics are consistent with the overall patient population of UCLA Health, but the demographics of UCLA differ from those of Los Angeles.”
As a generalization, those individuals participating are wealthier, but with only 40% of participants being White, the cohort is “substantially more diverse,” with a large Middle East North African (MENA) population predominantly from Iran. The study found that when race/ethnicity, which we will return to in a moment, was broken down by similar genetic segments, heterogenous populations, i.e., Hispanics or MENA, could reveal more precise and helpful information. For example,
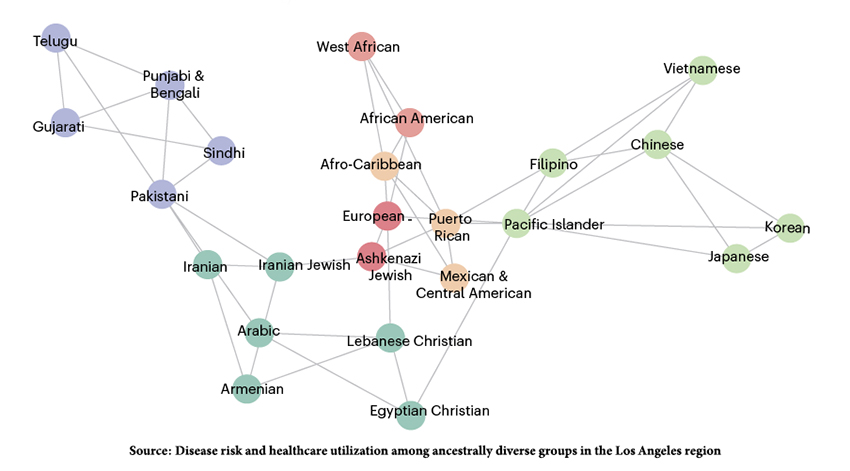
- Among Hispanic/Latino, there were genetic clusters for individuals from Puerto Rico, three different groups from Mexico and Central America, and an Afro-Caribbean cluster. Pulmonary disease was more prominent in the Afro-Caribbean cluster, while pregnancy-related anemia and more premature births were associated with Guatemalan and Central American groups.
- Hepatitis B is a frequent diagnosis for Asians, but in genetic segments, the bulk of the increased frequency was among those of Chinese descent, not Japanese.
- All Iranians shared a less likely risk of skin cancers, but Iranian Jews had more “adjustment disorders,” while non-Jewish Iranians had more multi-nodular goiter.
- Geography made a difference. Clusters within MENA were closely related, and the Pakastani cluster served as a bridge to South Asian clusters. For context, the Silk Road ran from the Middle East through what is today considered Pakistan into Asia.
The graphic shows the network formed by breaking down the category of Race/Ethnicity based on genetic similarity. The lines connecting the nodes reflect the top three linkages.

To Aggregate or Separate
As the study demonstrated, how data is categorized and sorted matters. Breaking down the category of race/ethnicity into smaller, more homogenous groups, termed more “granular,” yields useful information. Here are the definitions these researchers applied in getting granular.
Population – “a group of people with a common characteristic.” As the researchers note, an individual can belong to many populations. In the case of this study, there is one population, the members of UCLA Health, that participated in the genomic analyses.
Race – “a social construct” based on culturally identified characteristics, varying in time and context, and with “no biological basis.” The US Census recognizes seven categories White, Black, Latino, Asian, Native American/Alaska Native, and Native Hawaiian, as well as people of two or more races; the current study identified six, segregating the “one” of population into six bins or categories.
Ethnicity – closely aligned with race, is also a social construct based on “shared cultural or historical experience;” like race, it can further segregate. The US census recognizes two ethnicities, Hispanic or Latino, or not Hispanic or Latino.
The British Census recognizes 18 categories that combine race and ethnicity [1], creating a veritable Tower of Babel using either of these terms to stratify populations.
Genetic Ancestry – the genetic material shared with relatives, recent or distant, in terms of parentage. The family trees of 23andMe provide information on 47 populations broken into seven larger categories European, Central & South Asian, Indigenous American, East Asian, Sub-Saharan African, Western Asian & North African, and Melanesian.
 Identity is a self-determined value based on your perception of population, race, ethnicity, and genetic ancestry. As with any self-assessment, it is the most specific identifier but the least objective.
Identical-by-descent segments – the shared components of the genome “inherited from a common ancestor.” The UCLA researchers identified 367 segments in their population. These segments varied quite a bit in size, from 2 to 2047 individuals, the number of shared segments, and their geographic ancestry. While finely defined, they were too small to provide reliable statistical analysis.
Identity-by-descent-cluster – individuals who share more of their genome relative to others in the sample. These patterns reflect inheritance, social, cultural, and historical experience. They are judgments of what constitutes a pattern. As 23andMe described it,
“…we attempted to make the population or geographic region represented by each dataset as specific and granular as possible. We experimented with different groupings of country-level populations to find combinations that we could distinguish between.”
Those 367 segments were reduced to 24 clusters reflective of 98% of the UCLA Health population, producing “clusters differentiated enough to represent the diversity of ATLAS while still powered for statistical analyses.” In other words, the researchers created clusters reflecting a Goldilocks equilibrium, neither too large nor too small. That is a judgment and may or may not reflect bias or alter subsequent findings.
“…genetics is likely not the only causal factor for these results.”
When used by Big Data to generate algorithms, those judgments have been implicated in disparities in care. As the researchers write,
“We identified pathogenic loci that segregated at higher frequencies in the Chinese, Iranian Jewish, Armenian and African American clusters. Historically, in the United States, carrier screening guidelines are based on self-reported race and ethnicity. Many of the associations that we identified would be missed by these guidelines.”
If race/ethnicity is “too coarse” a categorization, should we abandon it entirely or replace it with some other measure? Should genetic similarity be substituted? Science has already demonstrated that culture and socioeconomics impact the expression of our genetic “blueprint.” It would not be surprising that the diseases affecting American Iranians differ from those Iranians still living in Iran or that Afro-American Blacks differ from the ancestor’s descendent still living in Africa.
“When translating results to individuals, the limitations of genetic ancestry must be considered. Genetic ancestry is continuous, and many individuals have multiple ancestries. Identity-by-descent clusters as a biomarker must be inclusive and tailored to individuals for clinical use.”
Population health is economically efficient in providing the “most good.” But it requires aggregation, which inevitably introduces bias because it is a human judgment. Personalized health is the least economical but provides the “best good.” Finding the best tradeoff between coarse and granular, aggregating or separating, is also a judgment. Pointing out that these judgments are biased without putting forward a better tradeoff does little to advance care.
[1]
- White - English / Welsh / Scottish / Northern Irish / British
- Irish, Gypsy or Irish Traveller, Any other White background
- Mixed / Multiple ethnic groups - White and Black Caribbean, White and Black African, White and Asian, Any other Mixed / Multiple ethnic backgrounds
- Asian / Asian British – Indian, Pakistani, Bangladeshi, Chinese, Any other Asian background
- Black / African / Caribbean / Black British – African, Caribbean, Any other Black / African / Caribbean background
- Other ethnic group – Arab, Any other ethnic group
Source: Disease risk and healthcare utilization among ancestrally diverse groups in the Los Angeles region Nature Medicine DOI: 10.1038/s41591-023-02425-1


