I’ve written in the past about upcoding in Medicare Advantage, where insurance companies document higher severity of illness for a patient than is the actual case. Insurance companies are not alone in this practice, as a study about hospital charges published in Health Affairs points out.
Hospital Medical Bills
Hospitals can charge a patient whatever they see fit. However, they are reimbursed by the federal government and commercial insurance companies, based on the Centers for Medicare and Medicaid’s (CMS) Inpatient Prospective Payment System (IPPS). [1] Hospitals receive a pre-determined payment after discharge based upon Medicare Severity Diagnosis Related Groups (MS-DRGs), which consider the reasons for admission (diagnosis) and the severity of illness.
Hospitals receive higher payments for treating more complex patients, categorized into 761 Medicare Severity Diagnosis-Related Groups (MS-DRGs). Each MS-DRG has up to three severity levels:
- Major complications and comorbidities (MCC)
- Complications and comorbidities (CC)
- No complications or comorbidities
Payment weights, reflecting resource intensity, are assigned to each MS-DRG level, with higher weights for greater severity, determining hospital reimbursement.
As with Medicare Advantage, there is an inherent incentive for hospitals, in this instance, to upcode a patient's comorbidities to increase payments. Increasing complications is a bit of a two-edged sword since it will increase payments but simultaneously reduce quality of care scores. Upcoding itself is not necessarily fraudulent and may more accurately describe a patient’s condition; in other cases, it perpetuates fraud and overpayment for the care actually rendered.
The researchers, all economists, used information on 37,942,945 discharges for 239 base MS-DRGs at 553 hospitals. They developed a predictive model “based on observable characteristics of the hospital stay, the hospital, and the patient,” quantifying the number of admissions coded at the highest level (Major complications and comorbidities) and compared that to the actual hospital coding.
Study Results

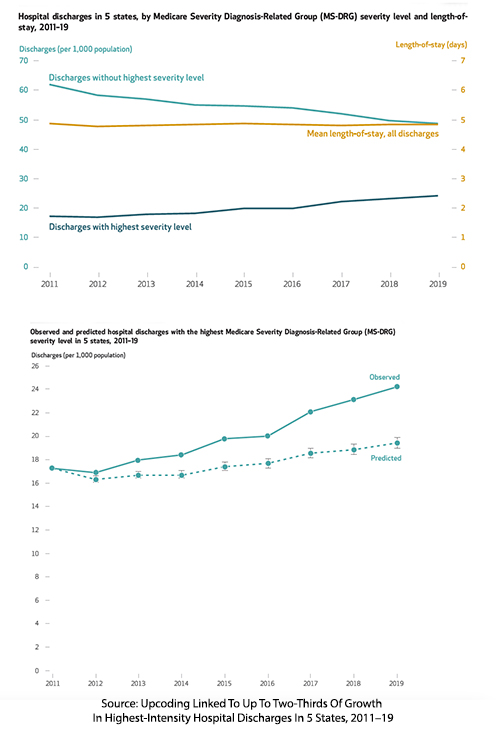
- Discharges with the highest MS-DRG severity level rose from 17.2 per 1,000 population in 2011 to 24.2 per 1,000 in 2019 (41% increase).
- After controlling for variables, discharges with the highest intensity grew from 17.2 to 19.4 per 1,000 population (13% increase).
- That difference between their model and hospital billing caused the researchers to conclude that approximately two-thirds of the increase in high-severity discharges by 2019 was unexplained by the model.
- These two-thirds, 4.8 additional discharges per 100,000, are the upper limits at what might be considered upcoding – 6.6% of all discharges.
They also noted variations in the overall rate of upcoding by state; e.g., New York had an upcoding rate of 3.6%, and Washington 24.5%. The top DRG groups showing severity increase were:
- Heart Failure and Shock: 27.0%
- Simple Pneumonia and Pleurisy: 16.1%
- Chronic Obstructive Pulmonary Disease (COPD): 17.2%
- Septicemia or Severe Sepsis Without Mechanical Ventilation (≥96 Hours): 5.0%
- Bronchitis and Asthma: 14.0%
No economic analysis would be complete without dollar figures.
“Using National Health Expenditure data from CMS, we estimated that the increase in MS-DRG payment weights was associated with $14.6 billion in payments in 2019, including $5.8 billion from private health plans and $4.6 billion from Medicare.”
Is This A Smoking Gun?
No. There are several reasons for the up-coded results. Most critically, as the researchers point out, they have no clinical data to conclude whether these increases are fraudulent. Given the researchers’ background as economists rather than physicians, it is doubtful they could make meaningful assessments of the clinical data even if available. There are some other factors to consider.
As part of their secondary analysis, the researchers looked at secondary diagnostic codes, which “elevate a discharge to the highest severity level.” None of their examples reflect increased complications – as I suggest, that form of upcoding comes with reductions in quality assessments that ultimately reduce a hospital’s Medicare “Stars” and payments. The secondary codes mentioned bring more specificity to a diagnosis and involve heart failure, the most commonly upcoded DRG. Rather than simply stating that a patient's reason for care, their “discharge” diagnosis was heart failure, the coding includes whether it involves diastolic, systolic, or both forms of failure – each combination receiving increasing weighted payment. Other examples include a secondary diagnosis of acute respiratory failure with hypoxia for the pneumonia DRG and a secondary diagnosis of lobar pneumonia as the source of sepsis without mechanical ventilation.
There is an ecological explanation. In 2017, CMS issued guidelines for how to code heart failure better. Technology has also aided the intensity of coding. As they write,
“the percentage of hospitals using certified electronic health records increased from 28% in 2011 to 96% in 2019. Previous studies documented that electronic health records are associated with an increase in diagnoses and complexity, although their impact on upcoding is unclear.”
However, as a former clinician, I most heartily agree with the researchers when they write, “hospitals may have continued to adapt and learn how to effectively code complexity.” Starting in 2007 or so, when the current hospital billing codes were implemented, there has been a new entry to the care team – a utilization worker who helps to facilitate and coordinate a timely discharge and, more importantly, works to ensure that the physician has documented the highest level of care they are providing. Without physician documentation, there is no coding, let alone upcoding. As a result, physicians saw an invasion of Post-it notes in the charts asking whether the patient had this or that nuanced diagnosis, much like the increase the researchers say in the coding of heart failure as systolic, diastolic, or both. Physicians, thankfully, are not trained in coding, so we might simply conclude that this is the administration helping us maximize legitimate reimbursement. That argument could be easily made in the past when fewer physicians were hospital employees; today, a conflict-of-interest angle remains unexplored.
There are also times when the utilization coordinator asks imponderable questions. My favorite was whether a patient with gangrene had it because of diabetes rather than simply atherosclerosis. In fact, the patient had peripheral vascular disease, heart disease, and perhaps some kidney dysfunction, all related to atherosclerosis and diabetes, so for me, it was a chicken or egg question. For utilization, it made a big $$ difference because gangrene from diabetes resulted in an upgraded DRG and payment.
These nuances are why simply looking at the numbers fails to reveal whether hospitals are, in fact, accurately or fraudulently upcoding care. In a world where we might “trust, but verify,” it is the verification that requires a more educated understanding that will never come from studying the administrative data.
Hospital upcoding is no smoking gun for fraud, but it’s also not entirely innocent. Whether it’s due to better coding practices, technology, or a push for higher reimbursements, the financial stakes are clear. As policymakers grapple with rising healthcare costs, distinguishing legitimate complexity from creative billing is challenging. For now, hospitals, physicians, and patients remain tangled in a system that rewards financial acumen as much as medical care—perhaps more than it should.
[1] For example, a friend recently underwent a trans-urethral resection of the prostate, TURP, a very common operation done on men to relieve the obstruction caused by the prostate as we age. The hospital charges came to approximately $46K, of which Medicare agreed to pay $6K.
Source: Upcoding Linked To Up To Two-Thirds Of Growth In Highest-Intensity Hospital Discharges In 5 States, 2011–19. Health Affairs DOI: 10.1377/hlthaff.2024.00596


